About the Contributor

Bella Khor, Senior Editor
Bella is a junior, and this is her second year on the Gazette/GraniteBayToday.org staff. She is a Senior Editor.
January 21, 2019
Gazette/GBT.org iIllustration/ABBIE GOULD
The California Dashboard was put into effect during 2017, and it has affected the RJUHSD among other Californian districts.
Change is inevitable, and there have been revolutionary advancements in technology and social inclusivity and awareness.
In the face of these developments, it’s only fair that education has evolved as well.
In March 2017, the California Department of Education and the State Board of Education implemented a new school accountability system, the California Dashboard.
The previous system, the Academic Performance Index, was comprised solely of scores from standardized testing. In 2013, the API was suspended, and the CDE created the California Dashboard.
The California Dashboard is a website that appears to be modeled after business dashboards, built for easy comprehension of large amounts of data.
With bright symbols and charts, it is a stark contrast from the text-dense reports of the API – the objective of this simplistic overview is to present large amounts of data in an easily accessible format.
Of course, specific data and calculations are also available, but require some navigation of the Dashboard website.
Paige Stauss, the president of Roseville Joint Union High School Board of Trustees, approves of the new format.
“I think that dashboards are the current assessment tool for many companies and nonprofits, and gives you multiple measures to review,” Stauss said. “It is clear and easy to read.”
Principal Jennifer Leighton agreed.
“This change was definitely needed as schools should be evaluated on more than just test scores,” Leighton said.
The new state dashboard allows schools to be judged by more than just their academic performance.
David Byrd, principal of Roseville High School, said this system “has more emphasis on suspensions and attendance,” both of which are parts of schools that were not measured by the API.
This presentation of data for suspensions, in particular, has received attention from district administrators.
The district has made adjustments and appears to be focusing on “suspension and attendance for some specific demographic groups” Byrd said.
Strauss said the district-wide focus, including the “1.7 percent increase (in) suspensions” for students with disabilities” got her attention and the attention of district leaders.
Schools in the district have been tweaking the way they approach student discipline, dealing with individual students and faculty.
At GBHS, this is demonstrated by how “we’ve moved to much more of a restorative model where we use each instance as a teaching opportunity, rather than moving directly to the traditional consequences of detention and/or suspension,” Leighton said.
Leighton added that the consequences for unruly or inappropriate behavior are now more “creative and thorough as well.”
Even district continuation schools that are not included in the current model of the dashboard, such as Adelante High, are being affected by the new reporting system.
Amy Lloyd, the principal at Adelante, said her school has lowered suspensions as demanded by the dashboard system.
“We have taken a different approach (than) suspending for being in the possession of drug paraphernalia (vape pens, rolling papers, lighters, etc.), and for being under the influence,” Lloyd said.
She then explained the action she and other administrators at Adelante currently take – confiscating the item, alerting the student’s parents and providing opportunities for counseling. Only after multiple incidences or a student is caught under the influence will there be a suspension.
“The idea is to exhaust other means of correction,” Lloyd said.
Numerical data is undoubtedly a huge component in the dashboard’s school reports, however the initial judgment of the system is based solely on a school and district’s progress from previous years.
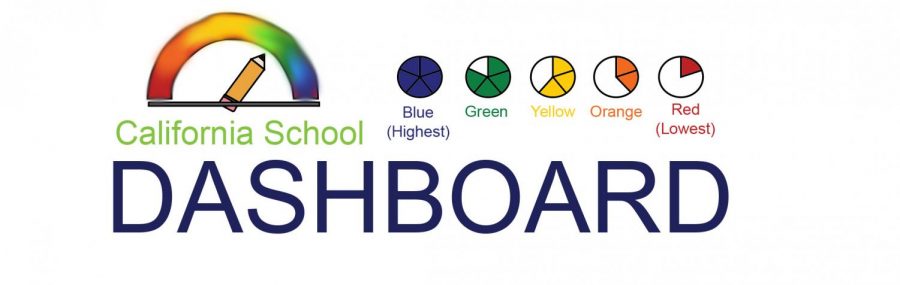
The dashboard uses a series of different colored symbols to show the performance level of the schools, with blue being the highest quintile ranking and red the lowest.
These symbols can appear to be misleading to those who are unaware of the additional information provided on the website that can be found through some explorative navigation.
Roseville High’s improvement in graduation is rated a concerning yellow at first glance, for example, but the Roseville graduation rate is at 91 percent.
Despite this high number, the lack of improvement resulted in a yellow caution score, a potentially inaccurate representation.
A “school can easily move into the red even if they are at a high level but haven’t continued to show improvement each year,” Leighton said.
The bottom line?
“Data matters,” said Stauss, “and it will drive our goals.”
Bella is a junior, and this is her second year on the Gazette/GraniteBayToday.org staff. She is a Senior Editor.